Note
Go to the end to download the full example code.
Basic processing
A synthetic record: differentiate to strain rate, remove common-mode noise, band-pass.
import matplotlib.pyplot as plt
import numpy as np
import pandas as pd

from dasio import DASinfo
from dasio.synthetic import demo_record
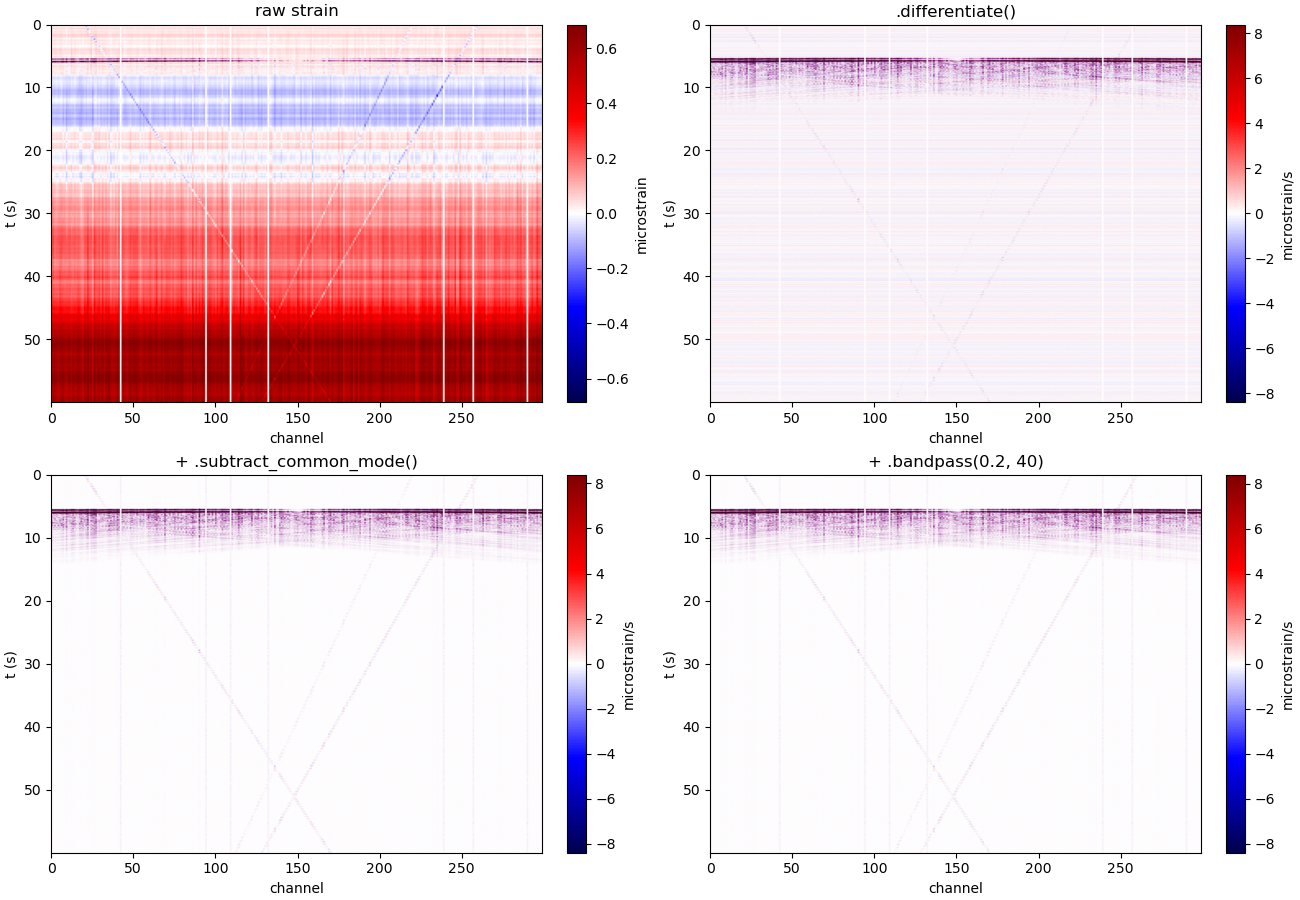
A synthetic roadside fibre: an earthquake with coda, three cars, ambient and instrument noise. 3 km, 60 s, microstrain.
d = demo_record()
Differentiate to strain rate, remove common-mode noise, then band-pass.
strain_rate = d.differentiate()
strain_rate_cm = strain_rate.subtract_common_mode()
strain_rate_bp = strain_rate_cm.bandpass(0.2, 40)
fig, axes = plt.subplots(2, 2, figsize=(13, 9), constrained_layout=True)
steps = (
    (d, 'raw strain'),
    (strain_rate, '.differentiate()'),
    (strain_rate_cm, '+ .subtract_common_mode()'),
    (strain_rate_bp, '+ .bandpass(0.2, 40)'),
)
for ax, (rec, title) in zip(axes.ravel(), steps):
    rec.plot(ax=ax)
    ax.set_title(title)
plt.show()
A channel catalog. index_raw is the interrogator channel of each row; it
defaults to the row position, which is only right when every channel is a
row, in order, so give it. taptest marks the channels with a location
(default 1), quality the ones worth keeping (default 1). lat and lon
are what the map and coordinate joins read. Here the first 20 channels sit
in the hut and a splice at 150 hides 10 more.
nx = d.nx
taptest = np.ones(nx, dtype=int)
taptest[:20] = 0
taptest[150:160] = 0
info = DASinfo(pd.DataFrame({
    'index_raw': np.arange(nx),
    'lat': 35.6 + np.arange(nx) * d.dx / 111e3,
    'lon': -117.6,
    'taptest': taptest,
}))
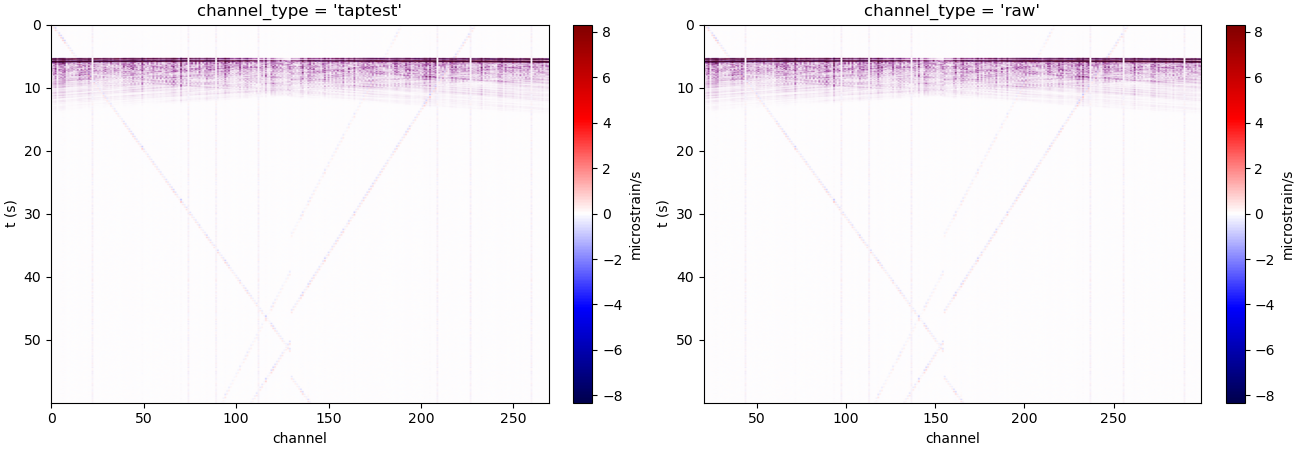
select_taptest drops the unlocated channels and switches the channel
numbering to the catalog’s. channel_type switches it back.
located = strain_rate_bp.select_taptest(info)
print(located.nx, 'of', nx, 'channels located')
print('taptest', located.channels()[:3], '... raw', located.channels(type='raw')[:3])

fig, axes = plt.subplots(1, 2, figsize=(13, 4.5), constrained_layout=True)
located.plot(ax=axes[0])
axes[0].set_title("channel_type = 'taptest'")
located.channel_type = 'raw'
located.plot(ax=axes[1])
axes[1].set_title("channel_type = 'raw'")
plt.show()
270 of 300 channels located
taptest [0 1 2] ... raw [20 21 22]
Total running time of the script: (0 minutes 2.768 seconds)