Note
Go to the end to download the full example code.
Local earthquake on the Ridgecrest South array
The M3.0 of 2026-01-08 05:28:06 UTC (USGS ci41154263) on the Ridgecrest
South array: catalog the directory with DASdb, read a window around the
event, strain rate, common-mode removal, band-pass, wiggles, and PhaseNet-DAS
picks if the pick extra is installed. Lab 1 of the DAS workshop.
The file is 2.4 GB, from the AI4EPS dataset on HuggingFace, downloaded once
to ~/.cache/dasio/.
import os
import urllib.request
from datetime import datetime, timedelta, timezone

import matplotlib.pyplot as plt

from dasio import DASdb, DASFile

URL = (
    'https://huggingface.co/datasets/AI4EPS/quakeflow_das/resolve/main/'
    'ridgecrest_south/data/RidgeCrest-South-2026-01-08T050503Z.h5')
CACHE = os.path.expanduser('~/.cache/dasio')
EVENT_TIME = datetime(2026, 1, 8, 5, 28, 6, tzinfo=timezone.utc)
path = os.path.join(CACHE, os.path.basename(URL))
if not os.path.exists(path):
    os.makedirs(CACHE, exist_ok=True)
    urllib.request.urlretrieve(URL, path)
One file: DASFile detects the format and reads it, whole or by sample.
f = DASFile(path)
print(f.format, f.origin)        # Proc, OptaSense: read() gives phase counts
Proc OptaSense
A directory: DASdb catalogs it once, then reads by time, across files.
30 s before the origin to 120 s after; the whole file would be 7 GB.
db = DASdb.from_dir(CACHE)
d = db.read(EVENT_TIME - timedelta(seconds=30), EVENT_TIME + timedelta(seconds=120))
d = d.to_physical()              # counts -> microstrain

# Seconds from the origin, so the event is at t = 0.
d.reftime = EVENT_TIME
scan:   0%|          | 0/3 [00:00<?, ?file/s]
scan: 100%|██████████| 3/3 [00:00<00:00, 2135.59file/s]
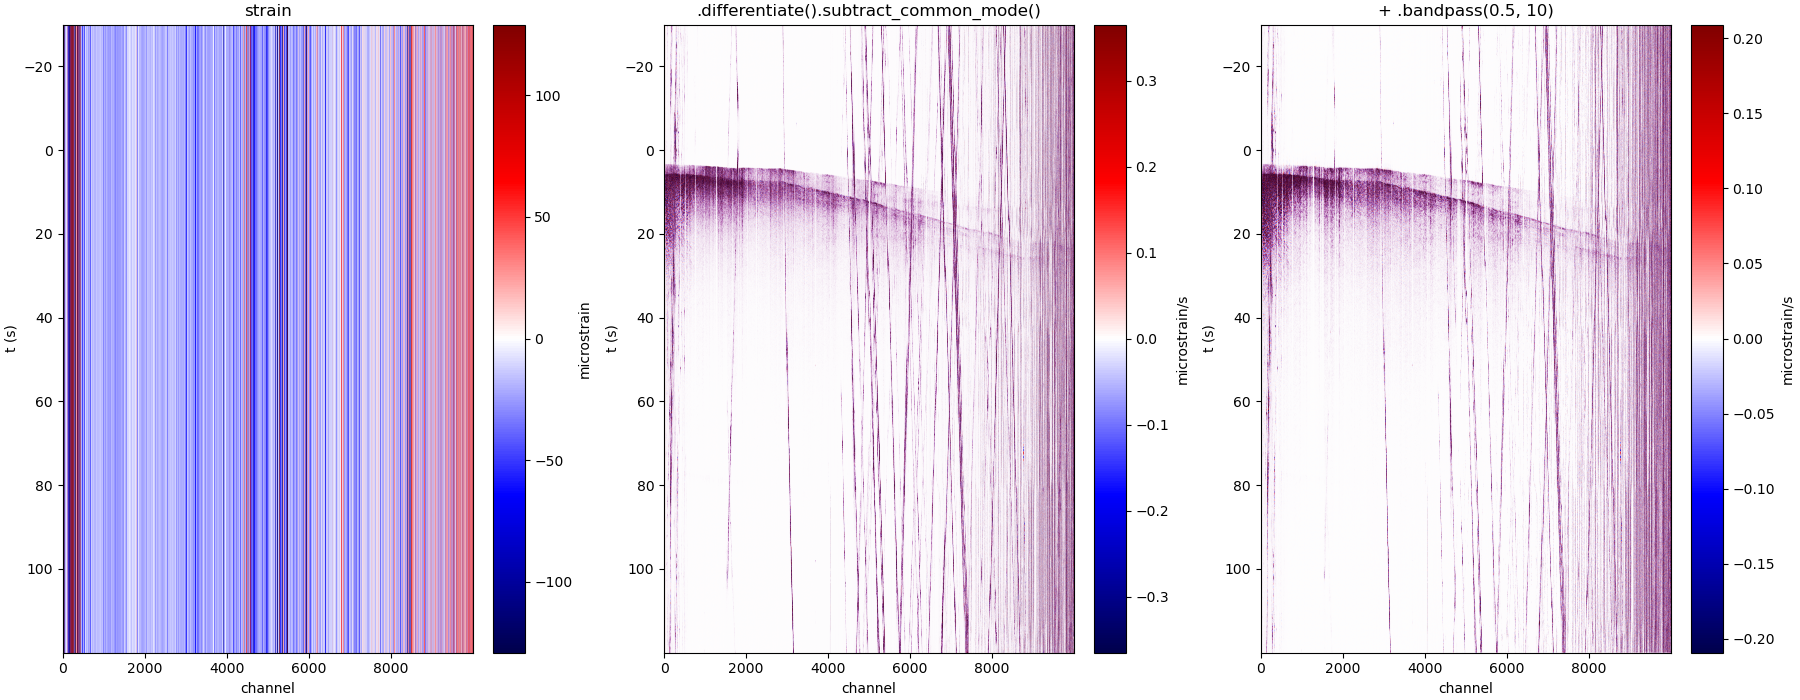
strain_rate = d.differentiate().subtract_common_mode()
strain_rate_bp = strain_rate.bandpass(0.5, 10.0)

fig, axes = plt.subplots(1, 3, figsize=(18, 7), constrained_layout=True)
steps = (
    (d, 'strain'),
    (strain_rate, '.differentiate().subtract_common_mode()'),
    (strain_rate_bp, '+ .bandpass(0.5, 10)'),
)
for ax, (rec, title) in zip(axes, steps):
    rec.plot(ax=ax, perc=98)
    ax.set_title(title)
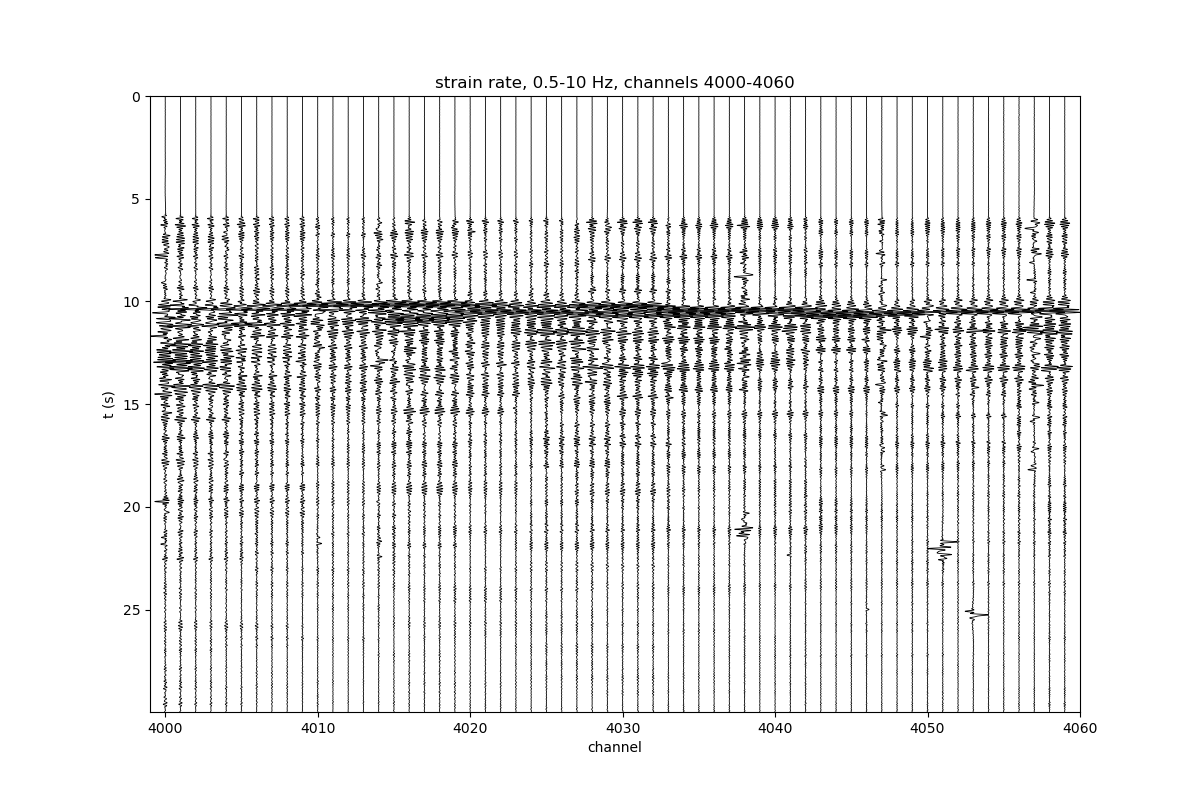
Sixty channels as wiggles.
wig = d.truncate(ch_range=(4000, 4060), t_range=(-5.0, 35.0)).differentiate().bandpass(0.5, 10.0)
ax = wig.plot.wiggle(t_range=(0.0, 30.0), figsize=(12, 8))
ax.set_title('strain rate, 0.5-10 Hz, channels 4000-4060')
Text(0.5, 1.0, 'strain rate, 0.5-10 Hz, channels 4000-4060')
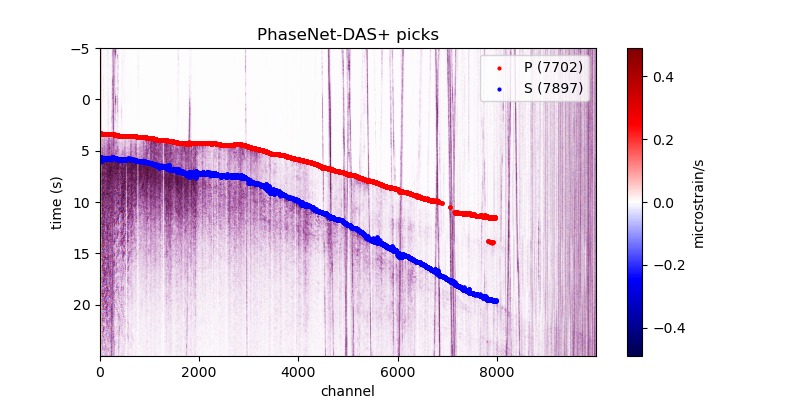
P and S picks on strain rate.
try:
    from dasio import pick_phases
except ImportError:
    print("pip install 'dasio[pick]' for PhaseNet-DAS picks")
else:
    picks = pick_phases(strain_rate, model='phasenet-das+', min_prob=0.3)
    ax, im = strain_rate.plot(perc=98, t_range=[-5, 25])
    picks.plot(ax=ax)
    ax.set_title('PhaseNet-DAS+ picks')
plt.show()
Total running time of the script: (0 minutes 42.422 seconds)